Multiomics integration
Here we will use dual-omics 10X PBMCs dataset link as an example to illustrate how SIMBA performs multiomics integration analysis,
Here we manually split cells into cells of RNAseq and ATACseq
[1]:
import os
import simba as si
si.__version__
[1]:
'1.0'
[2]:
workdir = 'multiome_10xpmbc10k_integration'
si.settings.set_workdir(workdir)
Saving results in: multiome_10xpmbc10k_integration
[3]:
si.settings.set_figure_params(dpi=80,
                              style='white',
                              fig_size=[5,5],
                              rc={'image.cmap': 'viridis'})
[4]:
# to make plots prettier
from IPython.display import set_matplotlib_formats
set_matplotlib_formats('retina')
[ ]:
load example data
[5]:
dict_adata = si.datasets.multiome_10xpbmc10k()
multiome_10xpbmc10k_rna.h5ad: 0.00B [00:00, ?B/s]
Downloading data ...
multiome_10xpbmc10k_rna.h5ad: 192MB [01:49, 1.76MB/s]
multiome_10xpbmc10k_atac.h5ad: 0.00B [00:00, ?B/s]
Downloaded to multiome_10xpmbc10k_integration/data.
Downloading data ...
multiome_10xpbmc10k_atac.h5ad: 700MB [05:59, 1.95MB/s]
Downloaded to multiome_10xpmbc10k_integration/data.
[6]:
dict_adata
[6]:
{'rna': AnnData object with n_obs × n_vars = 11909 × 36601
     obs: 'celltype'
     var: 'gene_ids', 'feature_types', 'genome',
 'atac': AnnData object with n_obs × n_vars = 11909 × 108377
     obs: 'celltype'
     var: 'gene_ids', 'feature_types', 'genome', 'chr', 'start', 'end'}
[7]:
adata_CP = dict_adata['atac']
adata_CG = dict_adata['rna']
[8]:
# manually split cells into RNAseq cells and ATACseq cells
adata_CP.obs.index = adata_CP.obs.index + '_atac'
adata_CG.obs.index = adata_CG.obs.index + '_rna'
[9]:
adata_CP.obs.head()
[9]:
| celltype | |
|---|---|
| AAACAGCCAAGGAATC-1_atac | 6 |
| AAACAGCCAATCCCTT-1_atac | 15 |
| AAACAGCCAATGCGCT-1_atac | 6 |
| AAACAGCCACACTAAT-1_atac | 1 |
| AAACAGCCACCAACCG-1_atac | 1 |
[10]:
adata_CG.obs.head()
[10]:
| celltype | |
|---|---|
| AAACAGCCAAGGAATC-1_rna | 6 |
| AAACAGCCAATCCCTT-1_rna | 15 |
| AAACAGCCAATGCGCT-1_rna | 6 |
| AAACAGCCACACTAAT-1_rna | 1 |
| AAACAGCCACCAACCG-1_rna | 1 |
[ ]:
ATAC-seq part
preprocessing
[11]:
si.pp.filter_peaks(adata_CP,min_n_cells=3)
Before filtering:
11909 cells, 108377 peaks
Filter peaks based on min_n_cells
/data/pinello/SHARED_SOFTWARE/anaconda_latest/envs/hc_simba/lib/python3.7/site-packages/pandas/core/arrays/categorical.py:2487: FutureWarning: The `inplace` parameter in pandas.Categorical.remove_unused_categories is deprecated and will be removed in a future version.
  res = method(*args, **kwargs)
After filtering out low-expressed peaks:
11909 cells, 107385 peaks
[12]:
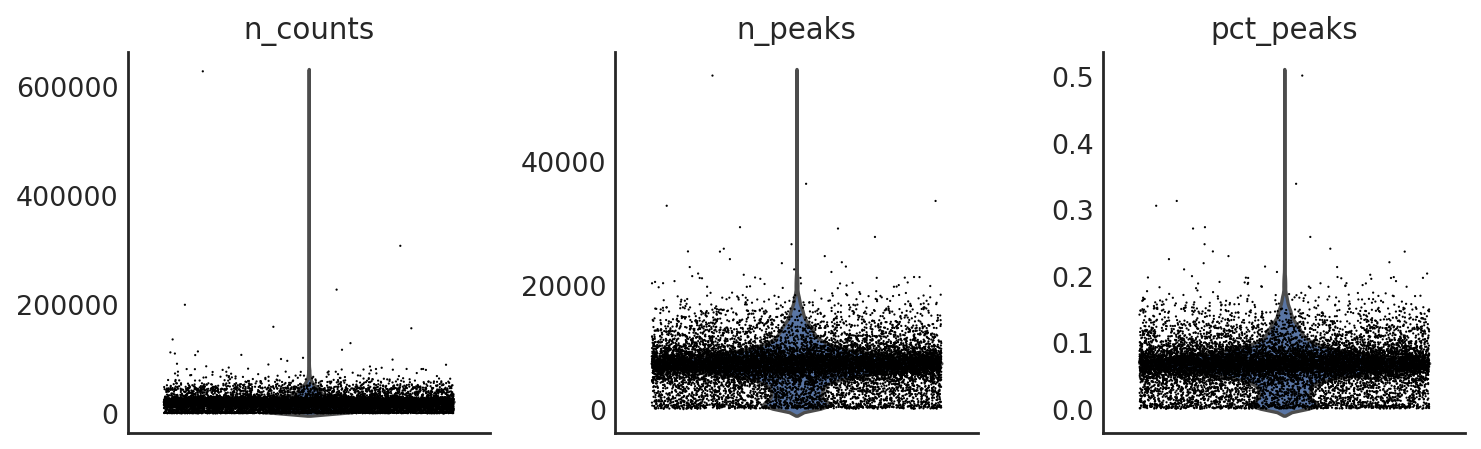
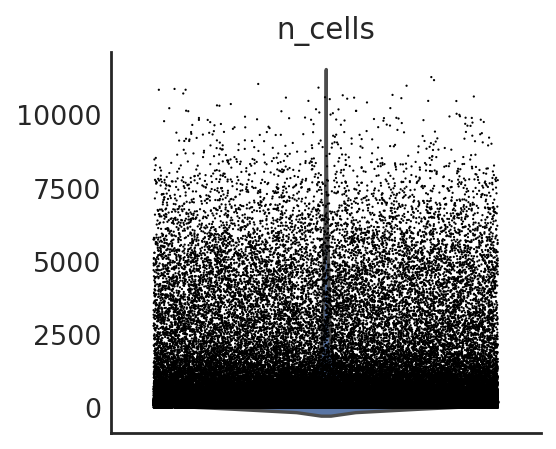
si.pp.cal_qc_atac(adata_CP)
[13]:
si.pl.violin(adata_CP,list_obs=['n_counts','n_peaks','pct_peaks'], list_var=['n_cells'])
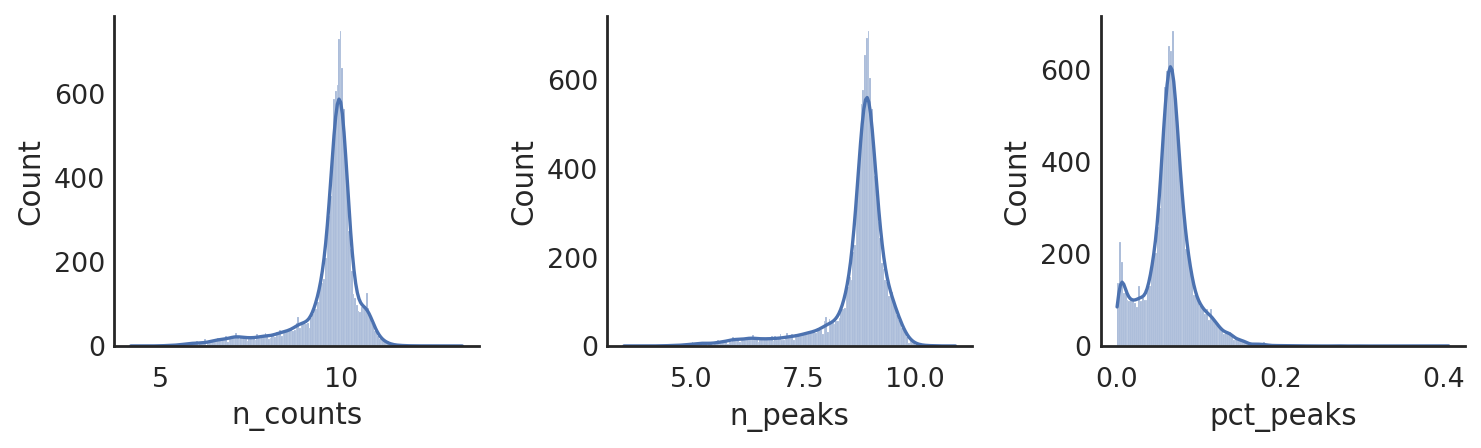
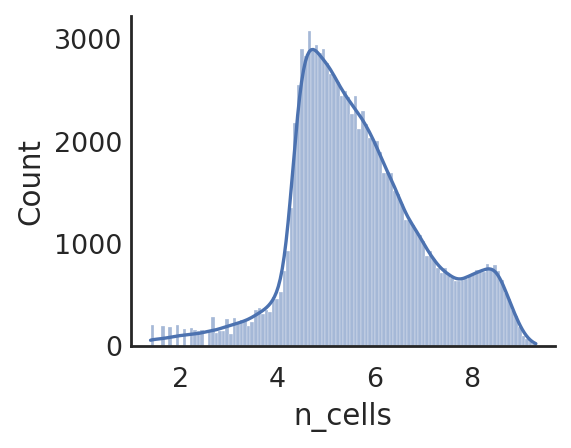
[14]:
si.pl.hist(adata_CP,list_obs=['n_counts','n_peaks','pct_peaks'], log=True, list_var=['n_cells'])
[ ]:
Filter out cells if needed:
si.pp.filter_cells_atac(adata_CP,min_n_peaks=100)
[ ]:
select peaks (optional)
It will speed up the trainning process by only keeping peaks associated with top PCs
[15]:
si.pp.pca(adata_CP, n_components=50)
[16]:
si.pl.pca_variance_ratio(adata_CP)
the number of selected PC is: 50
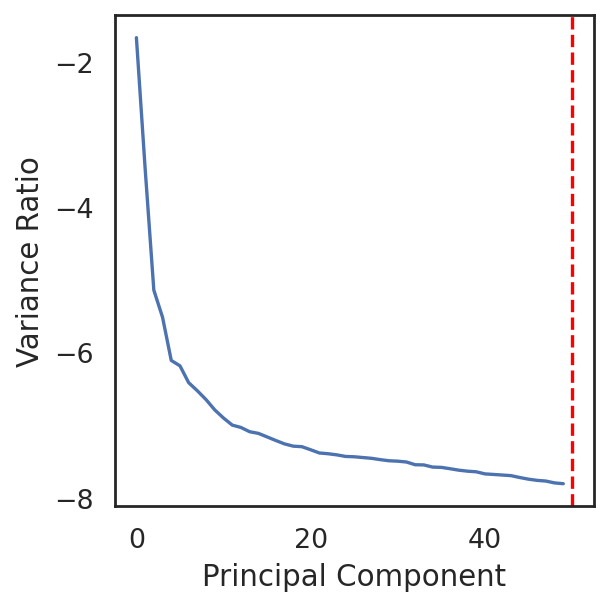
[17]:
#The number of selected PCs can be further reduced based on the elbow plot
si.pp.select_pcs(adata_CP,n_pcs=40)
[18]:
si.pp.select_pcs_features(adata_CP)
#features selected from PC 0: 18006
#features selected from PC 1: 17932
#features selected from PC 2: 17967
#features selected from PC 3: 17927
#features selected from PC 4: 18009
#features selected from PC 5: 17933
#features selected from PC 6: 17903
#features selected from PC 7: 17954
#features selected from PC 8: 17915
#features selected from PC 9: 17935
#features selected from PC 10: 17938
#features selected from PC 11: 17964
#features selected from PC 12: 17936
#features selected from PC 13: 17903
#features selected from PC 14: 17909
#features selected from PC 15: 17947
#features selected from PC 16: 17900
#features selected from PC 17: 17932
#features selected from PC 18: 18012
#features selected from PC 19: 17904
#features selected from PC 20: 17897
#features selected from PC 21: 17967
#features selected from PC 22: 17925
#features selected from PC 23: 17905
#features selected from PC 24: 17927
#features selected from PC 25: 17916
#features selected from PC 26: 17948
#features selected from PC 27: 17897
#features selected from PC 28: 17905
#features selected from PC 29: 17935
#features selected from PC 30: 17905
#features selected from PC 31: 17918
#features selected from PC 32: 17978
#features selected from PC 33: 17963
#features selected from PC 34: 18008
#features selected from PC 35: 17920
#features selected from PC 36: 17901
#features selected from PC 37: 17916
#features selected from PC 38: 17917
#features selected from PC 39: 17899
#features in total: 61189
[19]:
# si.pl.pcs_features(adata_CP, fig_size=(3,3))
[ ]:
RNA-seq part
preprocessing
[20]:
si.pp.filter_genes(adata_CG,min_n_cells=3)
Before filtering:
11909 cells, 36601 genes
Filter genes based on min_n_cells
/data/pinello/SHARED_SOFTWARE/anaconda_latest/envs/hc_simba/lib/python3.7/site-packages/pandas/core/arrays/categorical.py:2487: FutureWarning: The `inplace` parameter in pandas.Categorical.remove_unused_categories is deprecated and will be removed in a future version.
  res = method(*args, **kwargs)
After filtering out low-expressed genes:
11909 cells, 26349 genes
[21]:
si.pp.cal_qc_rna(adata_CG)
[22]:
si.pp.normalize(adata_CG,method='lib_size')
[23]:
si.pp.log_transform(adata_CG)
[24]:
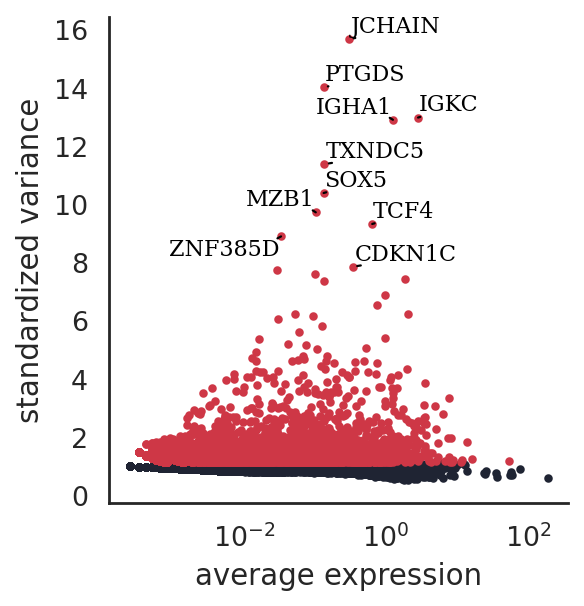
si.pp.select_variable_genes(adata_CG, n_top_genes=4000)
4000 variable genes are selected.
[25]:
si.pl.variable_genes(adata_CG,show_texts=True)
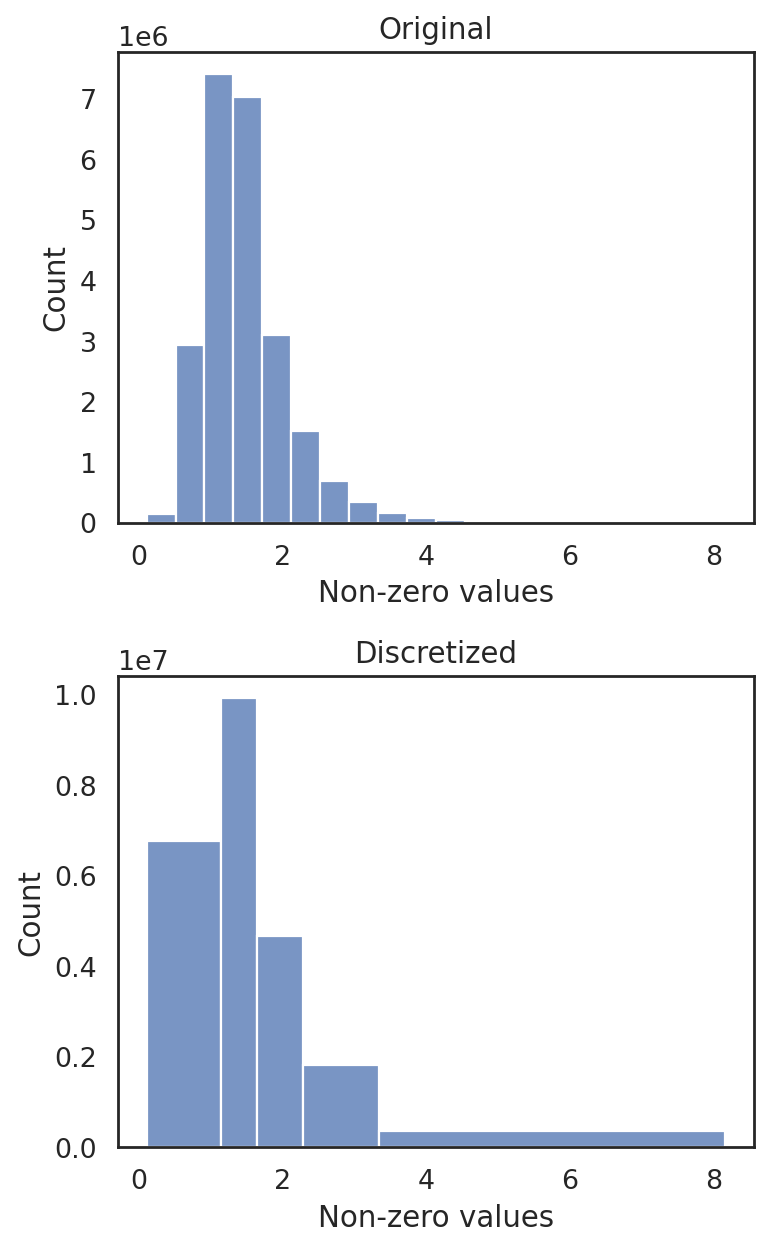
discretize RNA expression
[26]:
si.tl.discretize(adata_CG,n_bins=5)
[27]:
si.pl.discretize(adata_CG,kde=False)
[0.10545505 1.1394415 1.6413939 2.2801738 3.348012 8.160636 ]
[ ]:
Infer edges between cells of different modalities
[28]:
adata_CG_atac = si.tl.gene_scores(adata_CP,genome='hg38',use_gene_weigt=True, use_top_pcs=True)
Gene scores are being calculated for the first time
`use_precomputed` has been ignored
***** WARNING: File /tmp/pybedtools.g5f7se1e.tmp has inconsistent naming convention for record:
GL000194.1      101218  101619  61173

***** WARNING: File /tmp/pybedtools.g5f7se1e.tmp has inconsistent naming convention for record:
GL000194.1      101218  101619  61173

***** WARNING: File /tmp/pybedtools.g5f7se1e.tmp has inconsistent naming convention for record:
GL000194.1      101218  101619  61173

***** WARNING: File /tmp/pybedtools.g5f7se1e.tmp has inconsistent naming convention for record:
GL000194.1      101218  101619  61173
Processing: 0.0%
Processing: 20.0%
Processing: 40.0%
Processing: 60.0%
/data/pinello/SHARED_SOFTWARE/anaconda_latest/envs/hc_simba/lib/python3.7/site-packages/pandas/core/arrays/categorical.py:2487: FutureWarning: The `inplace` parameter in pandas.Categorical.remove_unused_categories is deprecated and will be removed in a future version.
  res = method(*args, **kwargs)
[29]:
si.pp.filter_genes(adata_CG_atac,min_n_cells=3)
si.pp.cal_qc_rna(adata_CG_atac)
si.pp.normalize(adata_CG_atac,method='lib_size')
si.pp.log_transform(adata_CG_atac)
Before filtering:
11909 cells, 38824 genes
Filter genes based on min_n_cells
After filtering out low-expressed genes:
11909 cells, 22786 genes
[30]:
adata_CrnaCatac = si.tl.infer_edges(adata_CG, adata_CG_atac, n_components=15, k=15)
#shared features: 2713
Performing randomized SVD ...
Searching for mutual nearest neighbors ...
89680 edges are selected
[32]:
adata_CrnaCatac
[32]:
AnnData object with n_obs × n_vars = 11909 × 11909
    obs: 'celltype', 'n_counts', 'n_genes', 'pct_genes', 'pct_mt'
    var: 'celltype', 'n_counts', 'n_peaks', 'pct_peaks', 'n_genes', 'pct_genes', 'pct_mt'
    obsm: 'svd'
    varm: 'svd'
    layers: 'conn'
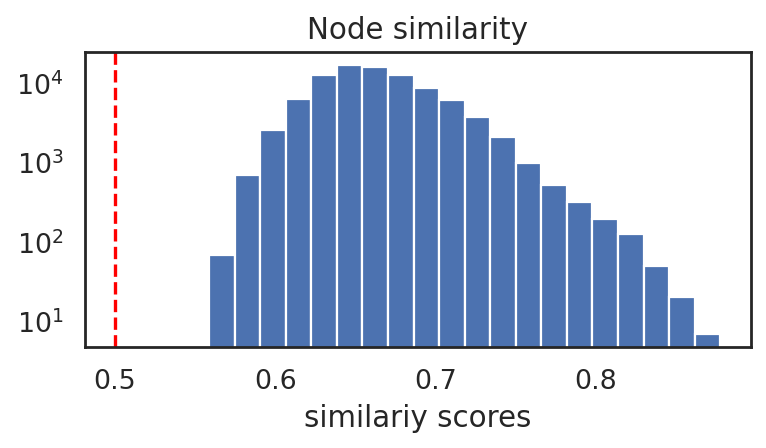
[31]:
si.pl.node_similarity(adata_CrnaCatac,cutoff=0.5)
#selected edges: 89680
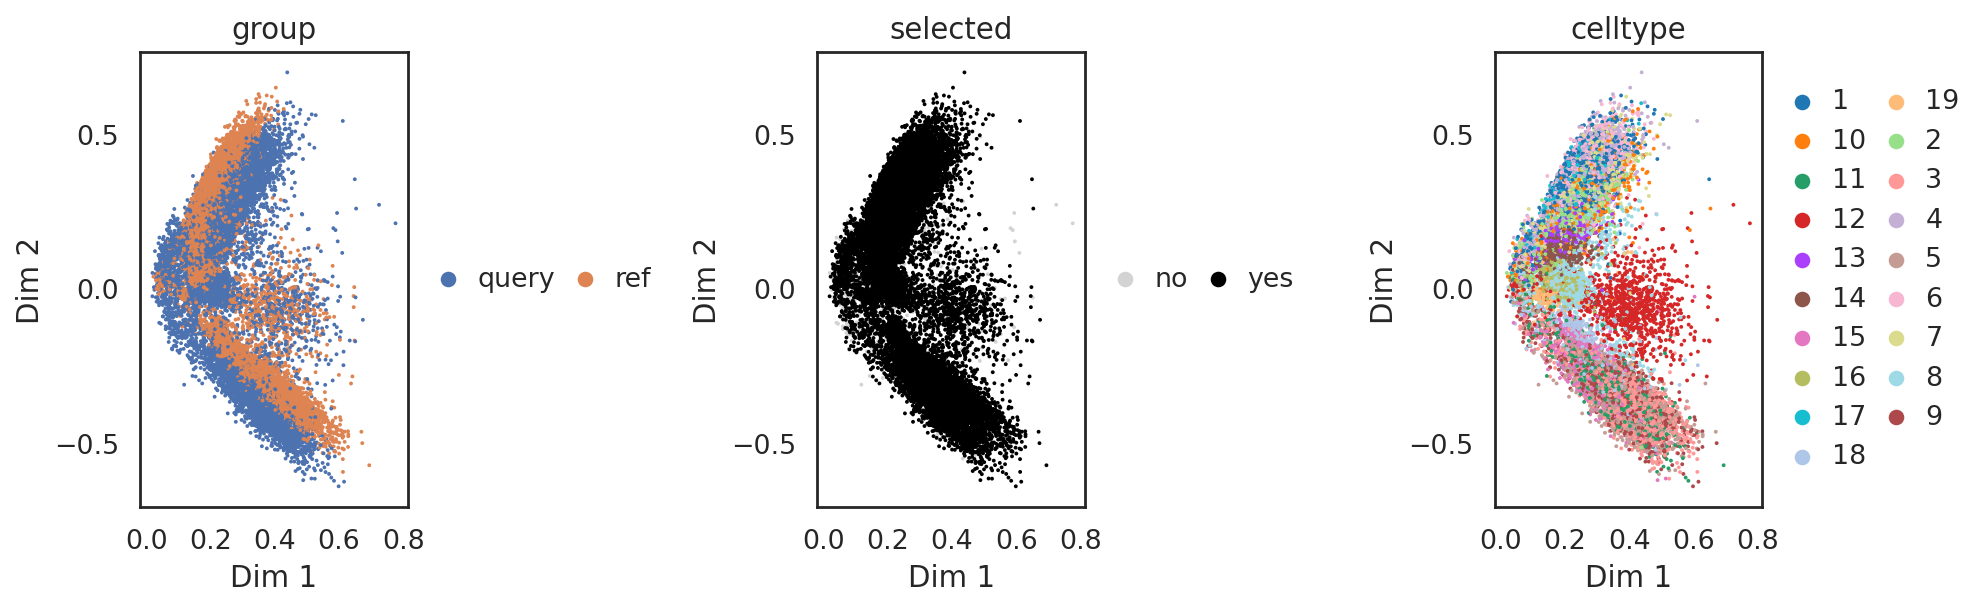
[33]:
si.pl.svd_nodes(adata_CrnaCatac,
                color=['celltype'],
                size=3,
                cutoff=0.5,
                fig_legend_ncol=2)
[34]:
# edges can be futhere trimmed if needed. Here we keep all of them
si.tl.trim_edges(adata_CrnaCatac, cutoff=0.5)
89680 edges are selected
[ ]:
generate Graph
[35]:
si.tl.gen_graph(list_CP=[adata_CP],
                list_CG=[adata_CG],
                list_CC=[adata_CrnaCatac],
                copy=False,
                use_highly_variable=True,
                use_top_pcs=True,
                dirname='graph0')
/data/pinello/SHARED_SOFTWARE/anaconda_latest/envs/hc_simba/lib/python3.7/site-packages/pandas/core/arrays/categorical.py:2487: FutureWarning: The `inplace` parameter in pandas.Categorical.remove_unused_categories is deprecated and will be removed in a future version.
  res = method(*args, **kwargs)
relation0: source: C, destination: P
#edges: 79782752
relation1: source: C2, destination: G
#edges: 967473
relation2: source: C2, destination: G
#edges: 1488857
relation3: source: C2, destination: G
#edges: 968440
relation4: source: C2, destination: G
#edges: 544749
relation5: source: C2, destination: G
#edges: 104139
relation6: source: C2, destination: C
#edges: 89680
Total number of edges: 83946090
Writing graph file "pbg_graph.txt" to "multiome_10xpmbc10k_integration/pbg/graph0" ...
Finished.
[ ]:
PBG training
Before PBG training, let’s take a look at the parameters:
[36]:
si.settings.pbg_params
[36]:
{'entity_path': 'multiome_10xpmbc10k_integration/pbg/graph0/input/entity',
 'edge_paths': ['multiome_10xpmbc10k_integration/pbg/graph0/input/edge'],
 'checkpoint_path': '',
 'entities': {'C': {'num_partitions': 1},
  'C2': {'num_partitions': 1},
  'G': {'num_partitions': 1},
  'P': {'num_partitions': 1}},
 'relations': [{'name': 'r0',
   'lhs': 'C',
   'rhs': 'P',
   'operator': 'none',
   'weight': 1.0},
  {'name': 'r1', 'lhs': 'C2', 'rhs': 'G', 'operator': 'none', 'weight': 1.0},
  {'name': 'r2', 'lhs': 'C2', 'rhs': 'G', 'operator': 'none', 'weight': 2.0},
  {'name': 'r3', 'lhs': 'C2', 'rhs': 'G', 'operator': 'none', 'weight': 3.0},
  {'name': 'r4', 'lhs': 'C2', 'rhs': 'G', 'operator': 'none', 'weight': 4.0},
  {'name': 'r5', 'lhs': 'C2', 'rhs': 'G', 'operator': 'none', 'weight': 5.0},
  {'name': 'r6', 'lhs': 'C2', 'rhs': 'C', 'operator': 'none', 'weight': 10.0}],
 'dynamic_relations': False,
 'dimension': 50,
 'global_emb': False,
 'comparator': 'dot',
 'num_epochs': 10,
 'workers': 4,
 'num_batch_negs': 50,
 'num_uniform_negs': 50,
 'loss_fn': 'softmax',
 'lr': 0.1,
 'early_stopping': False,
 'regularization_coef': 0.0,
 'wd': 0.0,
 'wd_interval': 50,
 'eval_fraction': 0.05,
 'eval_num_batch_negs': 50,
 'eval_num_uniform_negs': 50,
 'checkpoint_preservation_interval': None}
[ ]:
If no parameters need to be adjusted, the training can be simply done with:
si.tl.pbg_train(auto_wd=True, save_wd=True, output='model')
[ ]:
Here we show how to adjust training-related parameters if needed. In general, weight decay wd is the only parameter that might need to be adjusted based on the following pbg metric plots. However, in almost all the cases, the automatically decided wd (enabling it by setting auto_wd=True) works well.
E.g. we want to change the number of cpus workers:
[37]:
# modify parameters
dict_config = si.settings.pbg_params.copy()
# dict_config['wd'] = 0.000282
dict_config['workers'] = 12

## start training
si.tl.pbg_train(pbg_params = dict_config, auto_wd=True, save_wd=True, output='model')
Auto-estimated weight decay is 0.000282
`.settings.pbg_params['wd']` has been updated to 0.000282
Converting input data ...
[2021-06-29 18:08:26.269771] Found some files that indicate that the input data has already been preprocessed, not doing it again.
[2021-06-29 18:08:26.270171] These files are in: multiome_10xpmbc10k_integration/pbg/graph0/input/entity, multiome_10xpmbc10k_integration/pbg/graph0/input/edge
Starting training ...
Finished
[ ]:
If
wdis specified by users instead of being automatically decided, then make sure to update it in simba setting:
si.settings.pbg_params = dict_config.copy()
[ ]:
The trained result can be loaded in with the following steps:
By default, it’s using the current training result stored in .setting.pbg_params
# load in graph ('graph0') info
si.load_graph_stats()
# load in model info for ('graph0')
si.load_pbg_config()
Users can also specify different pathss
# load in graph ('graph0') info
si.load_graph_stats(path='./multiome_10xpmbc10k_integration/pbg/graph0/')
# load in model info for ('graph0')
si.load_pbg_config(path='./multiome_10xpmbc10k_integration/pbg/graph0/model/')
[ ]:
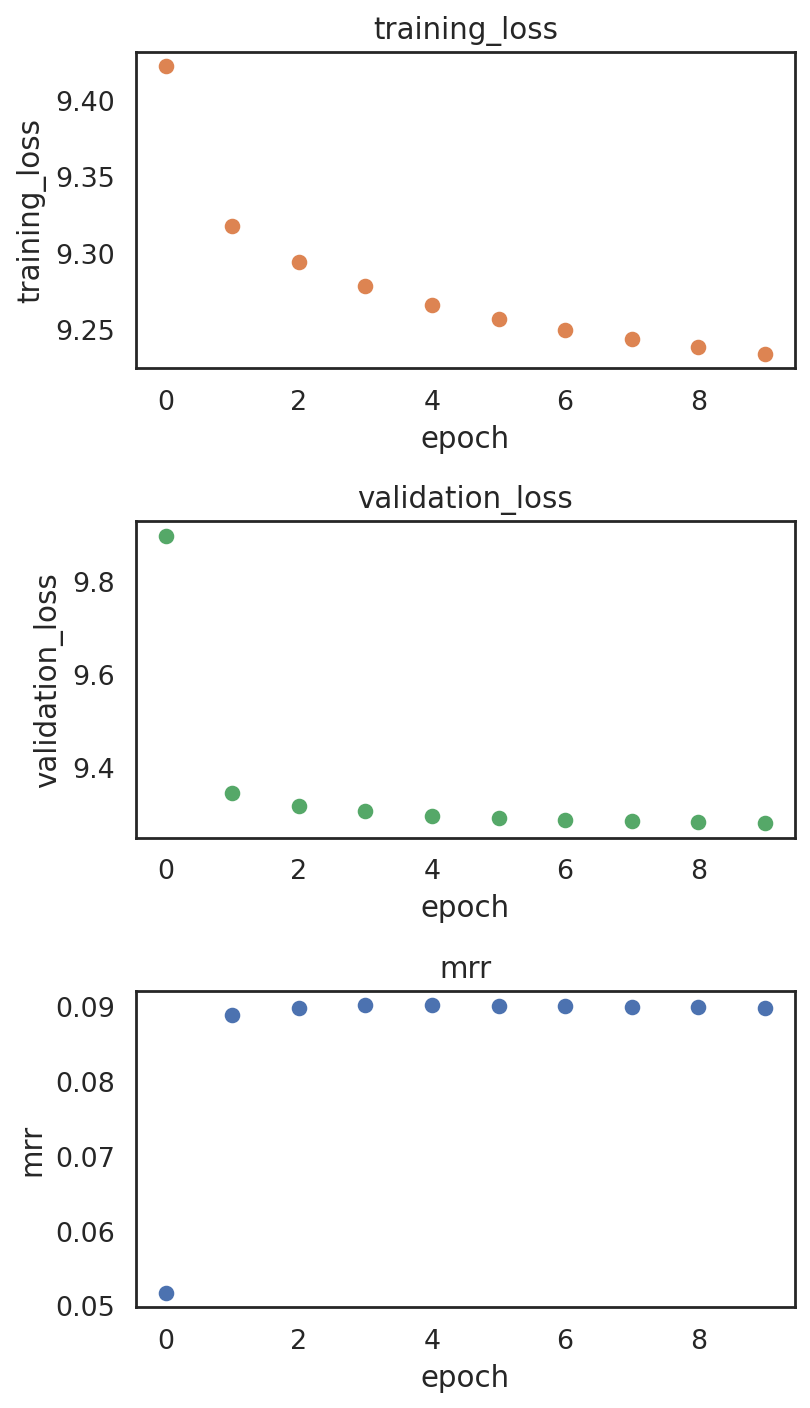
Plotting training metrics to make sure the model is not overfitting
[38]:
si.pl.pbg_metrics(fig_ncol=1)
[ ]:
Post-training Analysis
[52]:
dict_adata = si.read_embedding()
[53]:
dict_adata
[53]:
{'C': AnnData object with n_obs × n_vars = 11909 × 50,
 'C2': AnnData object with n_obs × n_vars = 11909 × 50,
 'G': AnnData object with n_obs × n_vars = 4000 × 50,
 'P': AnnData object with n_obs × n_vars = 61189 × 50}
[54]:
adata_C = dict_adata['C']  # embeddings for ATACseq cells
adata_C2 = dict_adata['C2']  # embeddings for RNAseq cells
adata_G = dict_adata['G']  # embeddings for genes
adata_P = dict_adata['P']  # embeddings for peaks
[55]:
adata_C
[55]:
AnnData object with n_obs × n_vars = 11909 × 50
[56]:
adata_C2
[56]:
AnnData object with n_obs × n_vars = 11909 × 50
[57]:
adata_G
[57]:
AnnData object with n_obs × n_vars = 4000 × 50
[58]:
adata_P
[58]:
AnnData object with n_obs × n_vars = 61189 × 50
[ ]:
[59]:
adata_CP.obs['celltype'] = adata_CP.obs['celltype'].astype(str)
adata_CG.obs['celltype'] = adata_CG.obs['celltype'].astype(str)

import seaborn as sns
import numpy as np
pal = sns.color_palette('deep', 10).as_hex() + sns.color_palette('pastel', 10).as_hex()
palette_celltype={x:pal[i] for i,x in enumerate(np.arange(1,20).astype(str))}
[ ]:
visualize embeddings of ATAC-seq cells
[60]:
## Add annotation of celltypes (optional)
adata_C.obs['celltype'] = adata_CP[adata_C.obs_names,:].obs['celltype'].copy()
adata_C
/data/pinello/SHARED_SOFTWARE/anaconda_latest/envs/hc_simba/lib/python3.7/site-packages/pandas/core/arrays/categorical.py:2487: FutureWarning: The `inplace` parameter in pandas.Categorical.remove_unused_categories is deprecated and will be removed in a future version.
  res = method(*args, **kwargs)
[60]:
AnnData object with n_obs × n_vars = 11909 × 50
    obs: 'celltype'
[61]:
si.tl.umap(adata_C,n_neighbors=15,n_components=2)
[63]:
si.pl.umap(adata_C,
           color=['celltype'],
           dict_palette={'celltype': palette_celltype},
           drawing_order='random',
           fig_size=(6,4),
           fig_legend_ncol=4)
[ ]:
visualize embeddings of RNA-seq cells
[64]:
## Add annotation of celltypes (optional)
adata_C2.obs['celltype'] = adata_CG[adata_C2.obs_names,:].obs['celltype'].copy()
adata_C2
/data/pinello/SHARED_SOFTWARE/anaconda_latest/envs/hc_simba/lib/python3.7/site-packages/pandas/core/arrays/categorical.py:2487: FutureWarning: The `inplace` parameter in pandas.Categorical.remove_unused_categories is deprecated and will be removed in a future version.
  res = method(*args, **kwargs)
[64]:
AnnData object with n_obs × n_vars = 11909 × 50
    obs: 'celltype'
[65]:
si.tl.umap(adata_C2,n_neighbors=15,n_components=2)
[66]:
si.pl.umap(adata_C2,
           color=['celltype'],
           dict_palette={'celltype': palette_celltype},
           drawing_order='random',
           fig_size=(6,4),
           fig_legend_ncol=4)
[ ]:
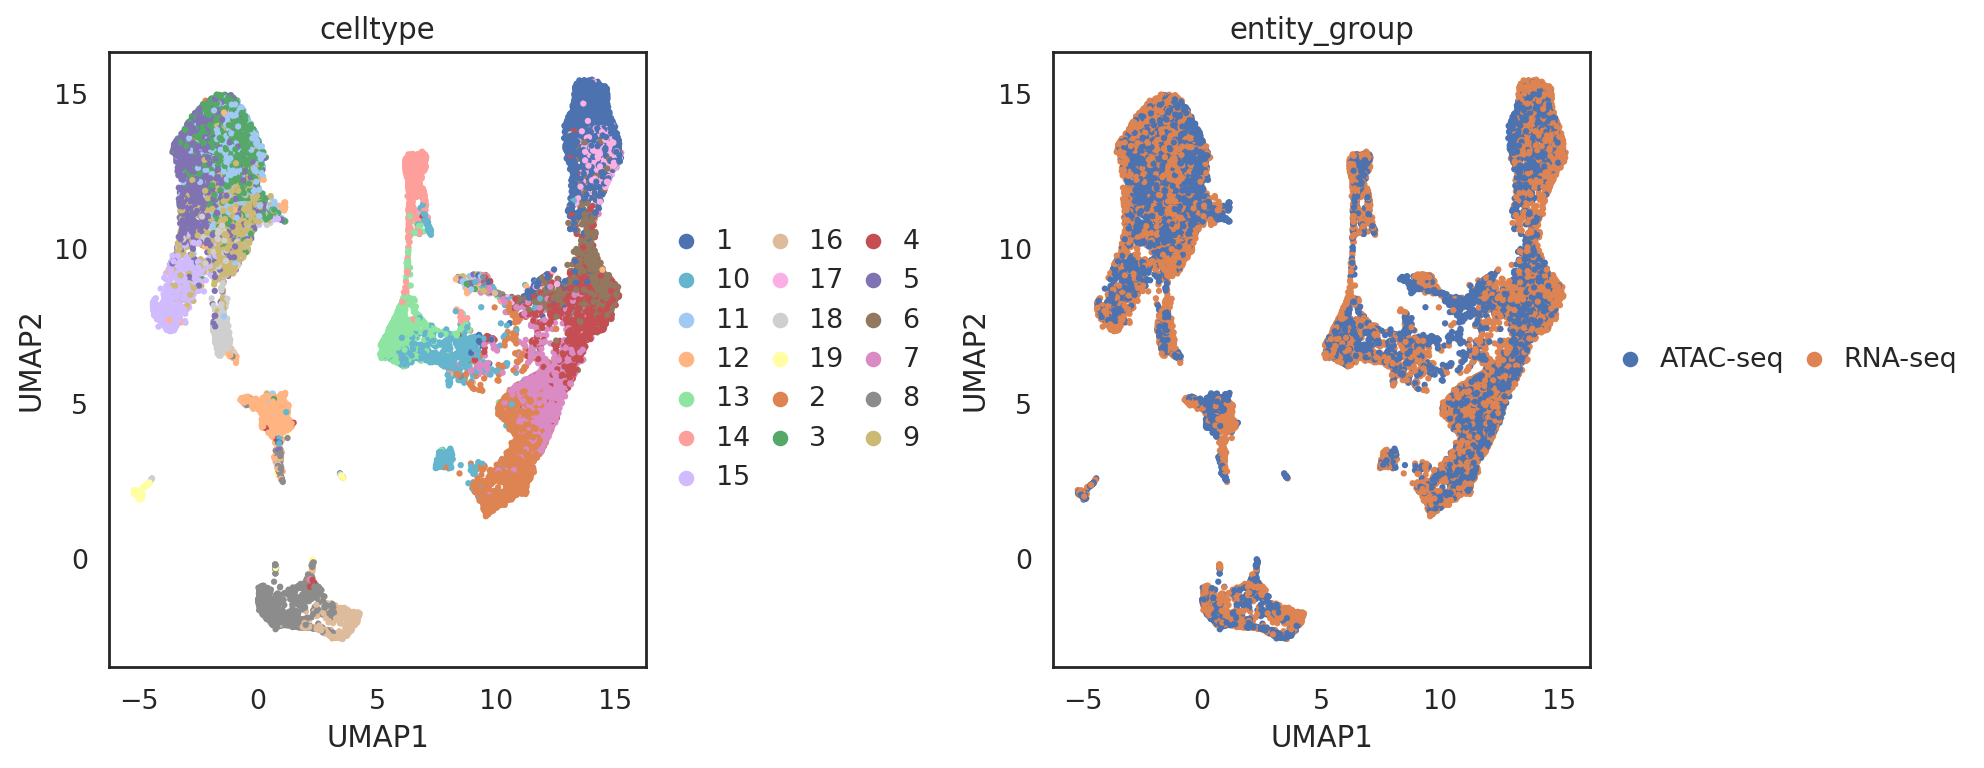
visualize embeddings of both ATACseq cells and RNAseq cells (RNAseq cells are used as the reference)
[67]:
adata_all = si.tl.embed(adata_ref=adata_C2,
                        list_adata_query=[adata_C],
                        use_precomputed=False)
Performing softmax transformation for query data 0;
[68]:
## add annotations of cells
adata_all.obs['entity_group'] = ""
adata_all.obs.loc[adata_C.obs_names, 'entity_group'] = "ATAC-seq"
adata_all.obs.loc[adata_C2.obs_names, 'entity_group'] = "RNA-seq"
adata_all.obs.head()
[68]:
| celltype | id_dataset | entity_group | |
|---|---|---|---|
| CCCAAATAGCCTGTTC-1_rna | 5 | ref | RNA-seq |
| TCAAGGAAGCAGCTCA-1_rna | 9 | ref | RNA-seq |
| AAAGGCTCACAGCCAT-1_rna | 2 | ref | RNA-seq |
| TATAGCTCACCTGCCT-1_rna | 3 | ref | RNA-seq |
| CGATTTGCACCTACTT-1_rna | 12 | ref | RNA-seq |
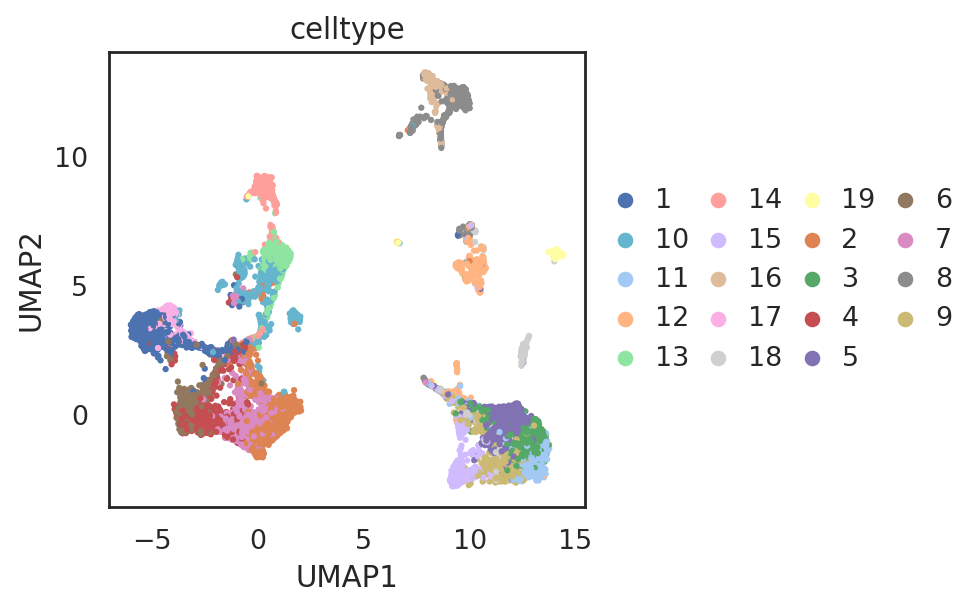
[69]:
si.tl.umap(adata_all,n_neighbors=15,n_components=2)
[71]:
si.pl.umap(adata_all,
           color=['celltype', 'entity_group'],
           dict_palette={'celltype': palette_celltype},
           drawing_order='random',
           fig_size=(6,5),
           fig_legend_ncol=3)
[ ]:
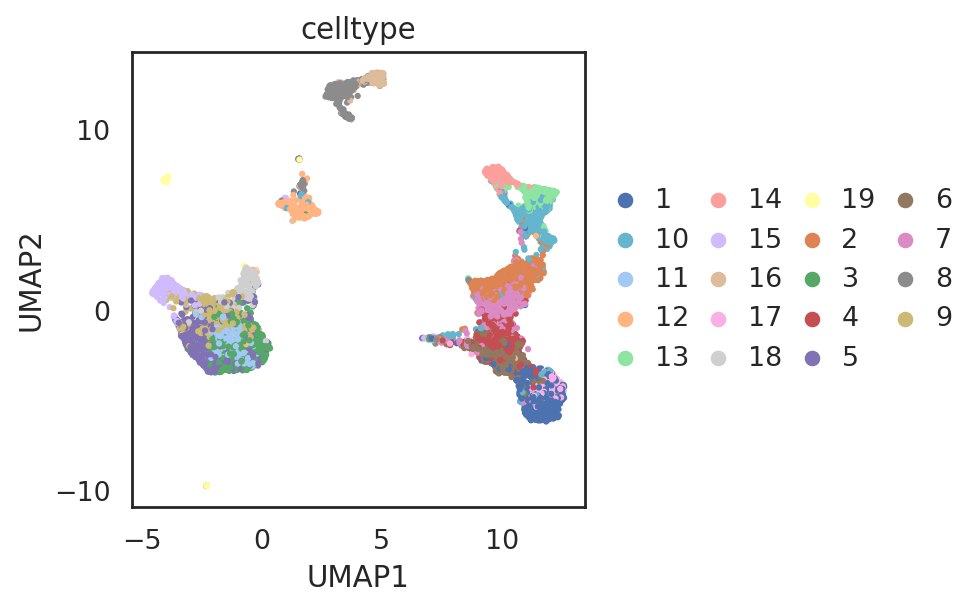
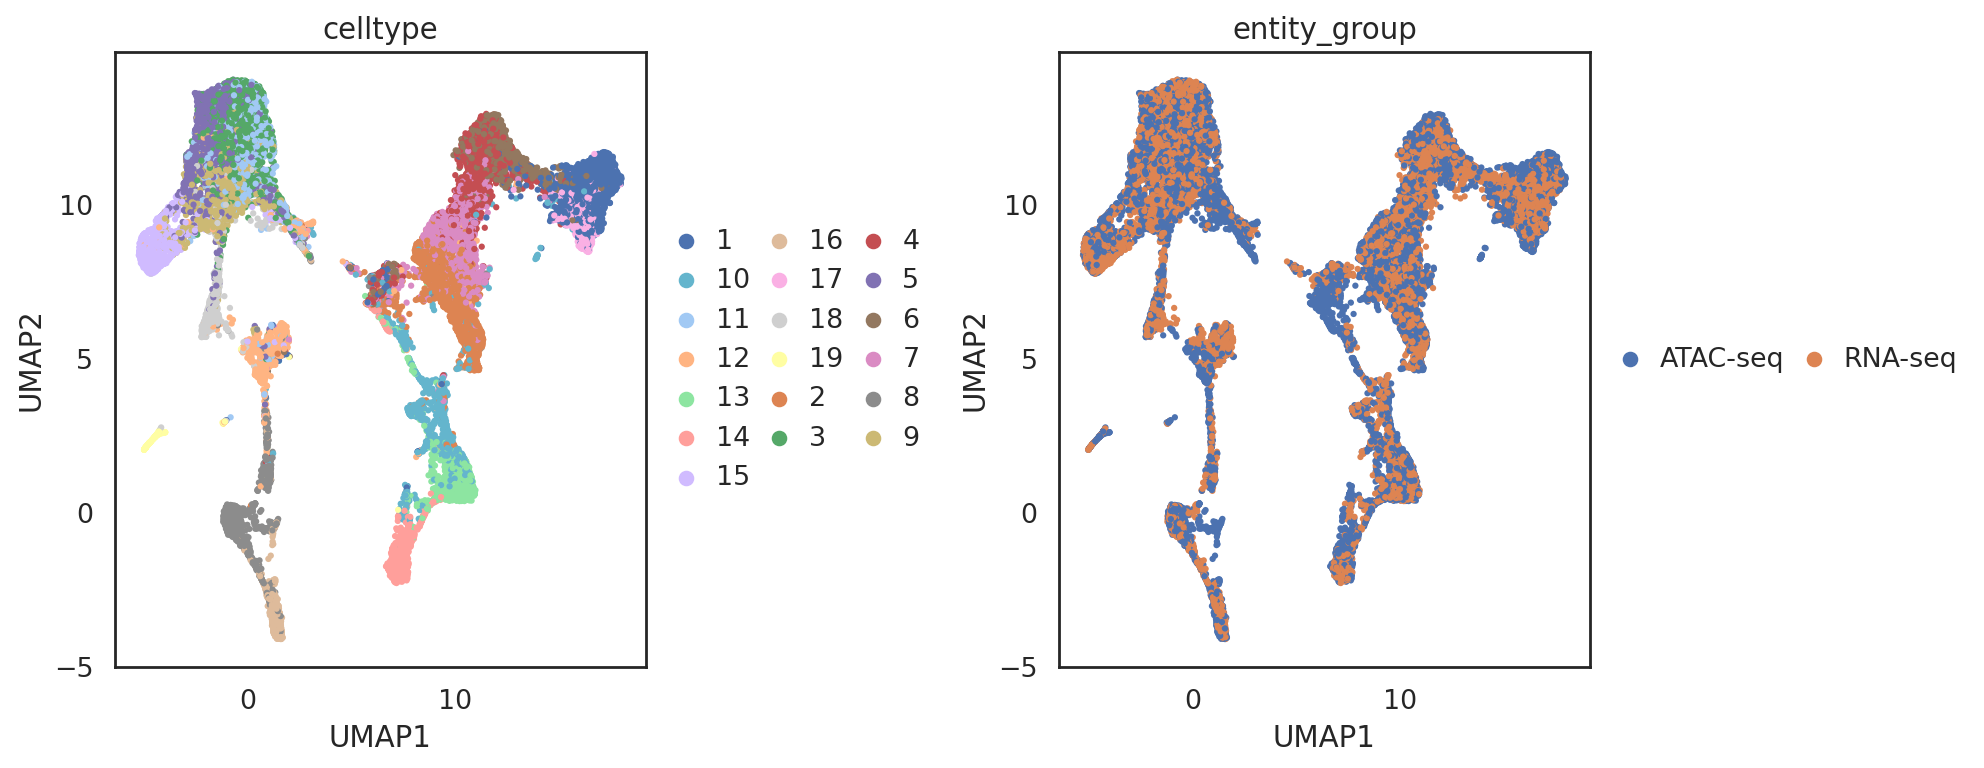
visualize embeddings of both ATACseq cells and RNAseq cells (ATACseq cells are used as the reference)
[72]:
adata_all2 = si.tl.embed(adata_ref=adata_C,
                        list_adata_query=[adata_C2])
Performing softmax transformation for query data 0;
[73]:
## add annotations of cells and genes
adata_all2.obs['entity_group'] = ""
adata_all2.obs.loc[adata_C.obs_names, 'entity_group'] = "ATAC-seq"
adata_all2.obs.loc[adata_C2.obs_names, 'entity_group'] = "RNA-seq"
adata_all2.obs.head()
[73]:
| celltype | id_dataset | entity_group | |
|---|---|---|---|
| GAGTAACCAGTTTGGC-1_atac | 2 | ref | ATAC-seq |
| TTGTCCATCCCTGATC-1_atac | 12 | ref | ATAC-seq |
| TTTCGTCCATGTGGGA-1_atac | 14 | ref | ATAC-seq |
| GCCTTTATCGTGCTTC-1_atac | 13 | ref | ATAC-seq |
| AGCACTAGTCACCTAT-1_atac | 1 | ref | ATAC-seq |
[74]:
si.tl.umap(adata_all2,n_neighbors=15,n_components=2)
[75]:
si.pl.umap(adata_all2,
           color=['celltype', 'entity_group'],
           dict_palette={'celltype': palette_celltype},
           drawing_order='random',
           fig_size=(6,5),
           fig_legend_ncol=3)
[ ]:
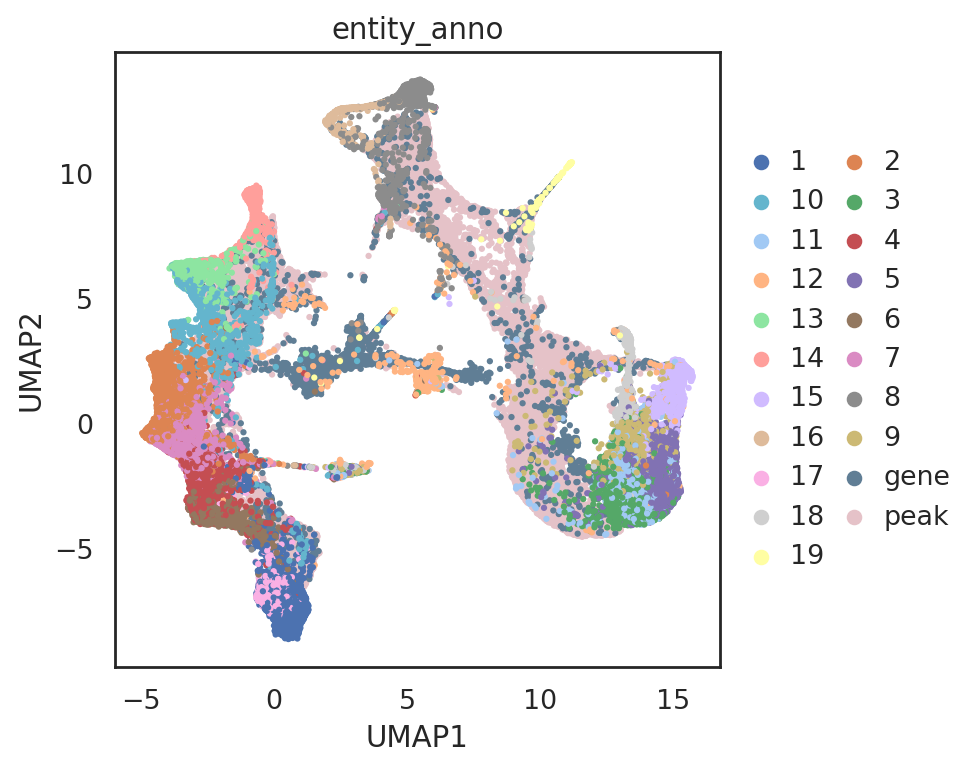
visualize embeddings of cells (both RNA-seq and ATAC-seq), genes, and peaks
[76]:
adata_all_CGP = si.tl.embed(adata_ref=adata_C2,
                            list_adata_query=[adata_C, adata_G, adata_P],
                            use_precomputed=False)
Performing softmax transformation for query data 0;
Performing softmax transformation for query data 1;
Performing softmax transformation for query data 2;
[77]:
# add annotations for all entities
adata_all_CGP.obs['entity_anno'] = ""
adata_all_CGP.obs.loc[adata_C.obs_names, 'entity_anno'] = adata_all_CGP.obs.loc[adata_C.obs_names, 'celltype'].tolist()
adata_all_CGP.obs.loc[adata_C2.obs_names, 'entity_anno'] = adata_all_CGP.obs.loc[adata_C2.obs_names, 'celltype'].tolist()
adata_all_CGP.obs.loc[adata_G.obs_names, 'entity_anno'] = 'gene'
adata_all_CGP.obs.loc[adata_P.obs_names, 'entity_anno'] = 'peak'
[78]:
# select cell-type specific peaks
adata_cmp_CP = si.tl.compare_entities(adata_ref=adata_C2, adata_query=adata_P)
peaks_selected = adata_cmp_CP.var_names[(adata_cmp_CP.var['max']>1.5) & (adata_cmp_CP.var['gini']>0.35)].tolist()
len(peaks_selected)
[78]:
19597
[79]:
# keep only cell-type specific peaks
adata_all_CGP_sub = adata_all_CGP[adata_C.obs_names.tolist() +
                                  adata_C2.obs_names.tolist() +
                                  adata_G.obs_names.tolist() +
                                  peaks_selected, :].copy()
[80]:
si.tl.umap(adata_all_CGP_sub,n_neighbors=15,n_components=2)
[82]:
palette_entity_anno = palette_celltype.copy()
palette_entity_anno['gene'] = "#607e95"
palette_entity_anno['peak'] = "#e5c2c8"
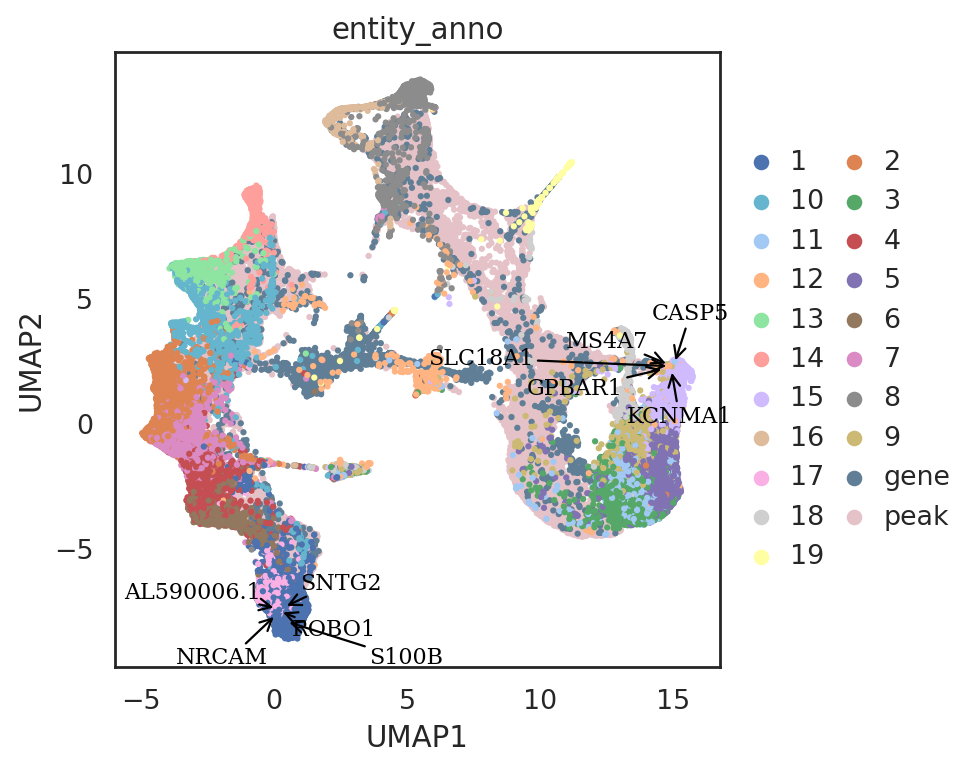
[83]:
si.pl.umap(adata_all_CGP_sub[::-1,],
           color=['entity_anno'],
           dict_palette={'entity_anno': palette_entity_anno},
           drawing_order='original',
           fig_legend_ncol=2,
           fig_size=(6,5))
Trying to set attribute `.uns` of view, copying.
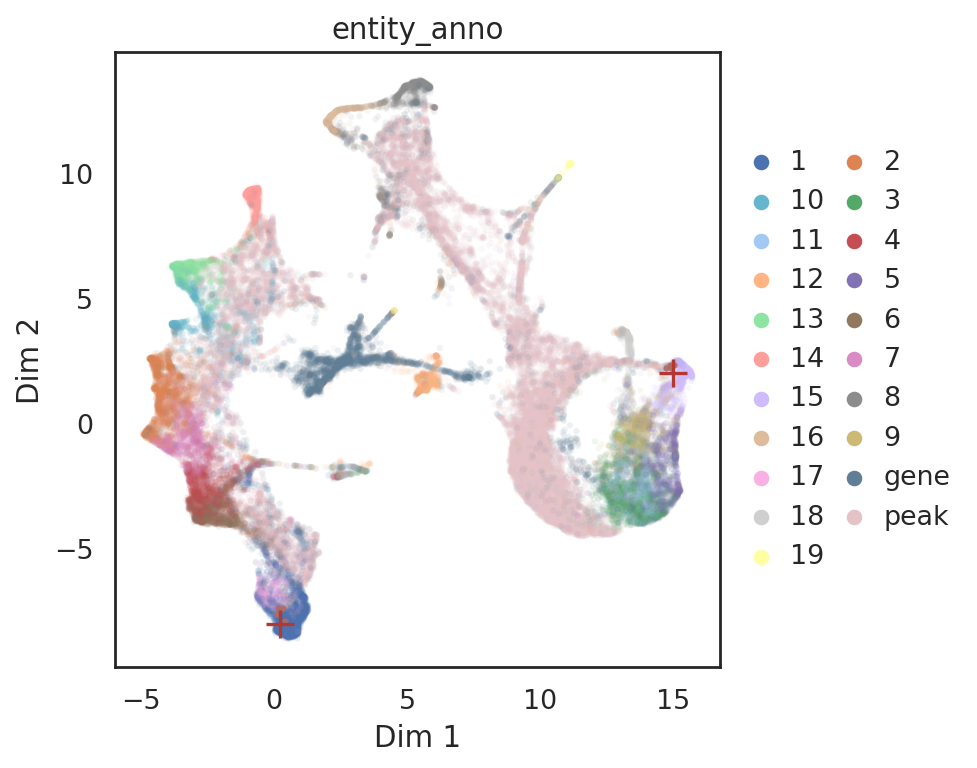
[86]:
# find neighbor genes of given pins
query_genes = si.tl.query(adata_all_CGP_sub,
                          pin=np.array([[0.2, -8],[15.0, 2.0]]),
                          use_radius=False,
                          k=5,
                          obsm='X_umap',
                          anno_filter='entity_anno',
                          filters=['gene'])
print(query_genes.shape)
query_genes.head()
(10, 5)
[86]:
| celltype | id_dataset | entity_anno | distance | query | |
|---|---|---|---|---|---|
| KCNMA1 | NaN | query_1 | gene | 0.223033 | 1 |
| S100B | NaN | query_1 | gene | 0.235300 | 0 |
| SLC18A1 | NaN | query_1 | gene | 0.307673 | 1 |
| CASP5 | NaN | query_1 | gene | 0.357289 | 1 |
| MS4A7 | NaN | query_1 | gene | 0.358432 | 1 |
[87]:
# show locations of pin points and its neighbor genes
si.pl.query(adata_all_CGP_sub,
            show_texts=False,
            color=['entity_anno'], dict_palette={'entity_anno': palette_entity_anno},
            alpha=0.9,
            alpha_bg=0.1,
            fig_legend_ncol=2,
            fig_size=(6,5))
[90]:
si.pl.umap(adata_all_CGP_sub[::-1],
           color=['entity_anno'],
           dict_palette={'entity_anno': palette_entity_anno},
           drawing_order='original',
           show_texts=True,
           texts=query_genes.index,
           text_expand=(1.2,1.4),
           fig_size=(6,5),
           fig_legend_ncol=2)
[ ]:
save results
[91]:
adata_CP.write(os.path.join(workdir, 'adata_CP.h5ad'))
adata_CG.write(os.path.join(workdir, 'adata_CG.h5ad'))
adata_CG_atac.write(os.path.join(workdir, 'adata_CG_atac.h5ad'))
adata_CrnaCatac.write(os.path.join(workdir, 'adata_CrnaCatac.h5ad'))

adata_C.write(os.path.join(workdir, 'adata_C.h5ad'))
adata_C2.write(os.path.join(workdir, 'adata_C2.h5ad'))
adata_G.write(os.path.join(workdir, 'adata_G.h5ad'))
adata_P.write(os.path.join(workdir, 'adata_P.h5ad'))

adata_all.write(os.path.join(workdir, 'adata_all.h5ad'))
adata_all2.write(os.path.join(workdir, 'adata_all2.h5ad'))
adata_all_CGP.write(os.path.join(workdir, 'adata_all_CGP.h5ad'))
... storing 'celltype' as categorical
... storing 'pbg_id' as categorical
... storing 'celltype' as categorical
... storing 'pbg_id' as categorical
... storing 'chr' as categorical
... storing 'strand' as categorical
... storing 'celltype' as categorical
... storing 'celltype' as categorical
... storing 'celltype' as categorical
... storing 'id_dataset' as categorical
... storing 'entity_group' as categorical
... storing 'celltype' as categorical
... storing 'id_dataset' as categorical
... storing 'entity_group' as categorical
... storing 'celltype' as categorical
... storing 'id_dataset' as categorical
... storing 'entity_anno' as categorical
Read back anndata objects
adata_CP = si.read_h5ad(os.path.join(workdir, 'adata_CP.h5ad'))
adata_CG = si.read_h5ad(os.path.join(workdir, 'adata_CG.h5ad'))
adata_CG_atac = si.read_h5ad(os.path.join(workdir, 'adata_CG_atac.h5ad'))
adata_CrnaCatac = si.read_h5ad(os.path.join(workdir, 'adata_CrnaCatac.h5ad'))

adata_C = si.read_h5ad(os.path.join(workdir, 'adata_C.h5ad'))
adata_C2 = si.read_h5ad(os.path.join(workdir, 'adata_C2.h5ad'))
adata_G = si.read_h5ad(os.path.join(workdir, 'adata_G.h5ad'))
adata_P = si.read_h5ad(os.path.join(workdir, 'adata_P.h5ad'))

adata_all = si.read_h5ad(os.path.join(workdir, 'adata_all.h5ad'))
adata_all2 = si.read_h5ad(os.path.join(workdir, 'adata_all2.h5ad'))
adata_all_CGP = si.read_h5ad(os.path.join(workdir, 'adata_all_CGP.h5ad'))
[ ]: